About Me
Brent Peruski - I graduated from Purdue University in 2021 with a Bachelor of Science in Industrial Engineering and a minor in Electrical & Computer Engineering.
Connect & Support
- Twitter: @bpdatabases
- Support: Venmo
bpdatabases
What began as a personal project to create a simple UI for tracking Red Wings games, and identifying the best matchups to watch across the league on a given night, has since evolved into this site. I have always been fascinated by the challenge of creating models that can explain complex, stochastic systems. Reading Stat Shot: A Fan's Guide to Hockey Analytics by Rob Vollman, and listening to the Evolving Hockey Podcast, inspired me to begin building my own models. My goal is to use advanced analytics to find the signal within the noise, making sense of seemingly random events by assigning probabilities to their outcomes. Most importantly, I wanted to focus this site around the comparison of these probabilistic, expected outcomes to actual on-ice results over differing sample sizes (ex. shots, goals, games, series and seasons).
All data on this site is sourced from the NHL’s API and processed through a nightly 3 AM ET ETL pipeline (powered by my laptop), then fed into my Expected Goals (xG) and Game Projection models. Now that this framework and pipeline are established, I plan to iterate upon the models over time.
This site is an independent project and is not affiliated with or endorsed by the National Hockey League (NHL). Its purpose is educational and analytical, offering original models, derived metrics, and detailed explanations to help users better understand hockey analytics and the role of randomness in game outcomes.
Expected Goals (xG) Model
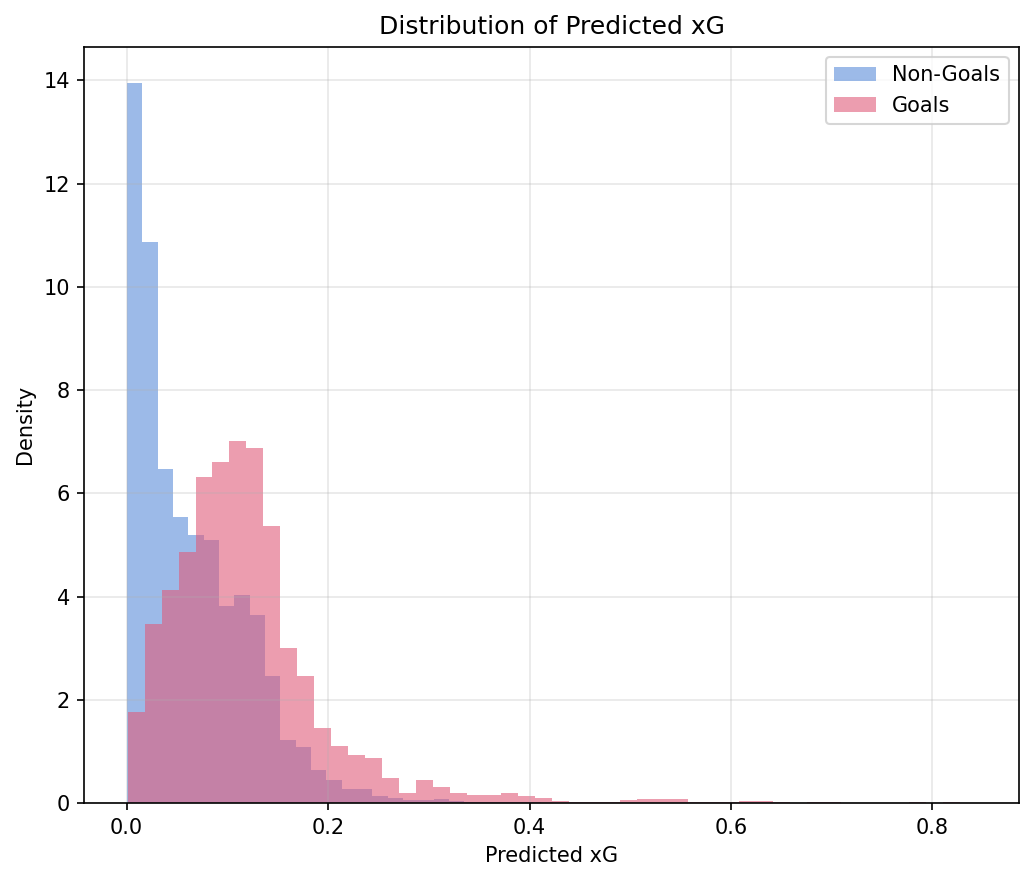
The majority of the analytics on this site are derived from my Expected Goals (xG) model. By focusing on shot quality over box score stats, xG provides a more stable metric by drawing richer information from every shot attempt rather than only those that become goals. For example, if you were assessing the performance of a team on a given night, xG takes into account the quality of the ~30 shots instead of just the ~3 goals. By expanding this to include the opponent's quality, we can calculate an xG For Percentage (xGF%), a metric that identifies which team earned the greater share of the expected goals. You can learn more about xG models from Evolving-Hockey, HockeyStats, and MoneyPuck, who have the best models that are publicly available. Hockey-Statistics also has a great write-up on building models.
I view xG primarily as a descriptive metric rather than a predictive one. It's a tool to identify the true merit of a performance by evaluating the quality of events that have already occurred. By focusing on the process, rather than the realized outcome, we can see through the randomness to better contextualize results. Instead of just answering "What happened?", xG allows us to answer "What did we expect to happen?" The space between those two answers is where the most interesting insights lie, prompting new theories, research, models and more.
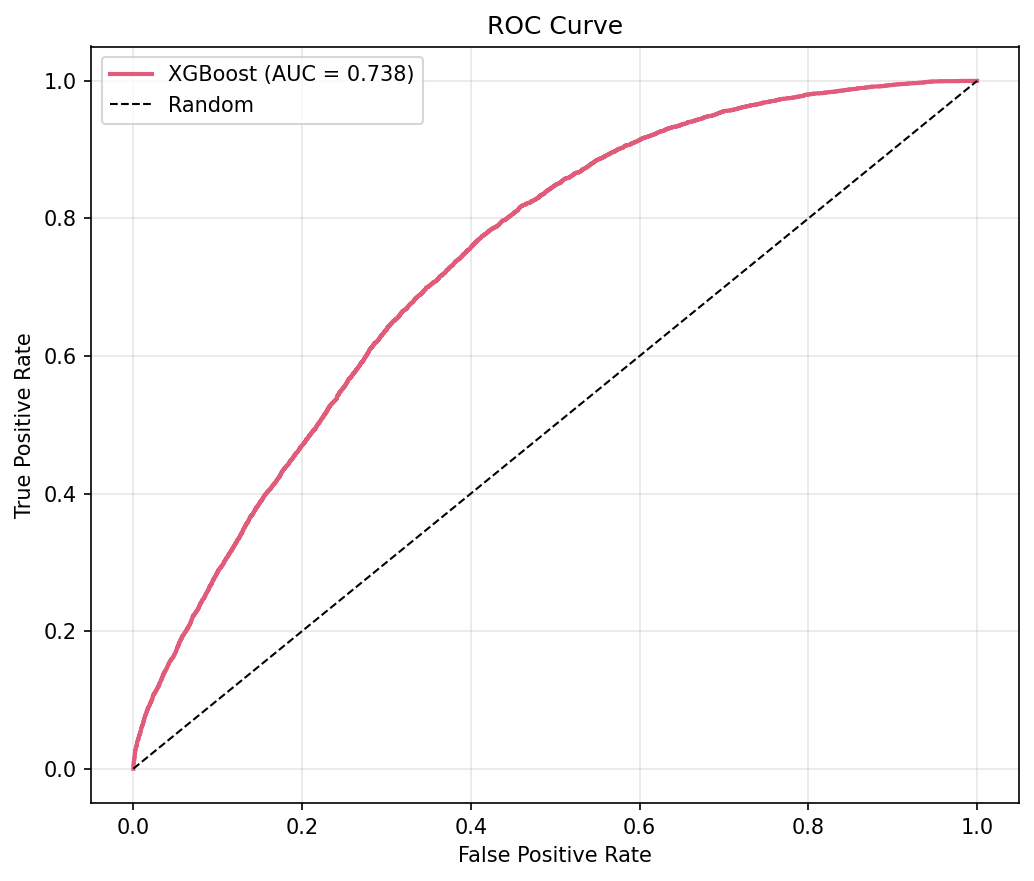
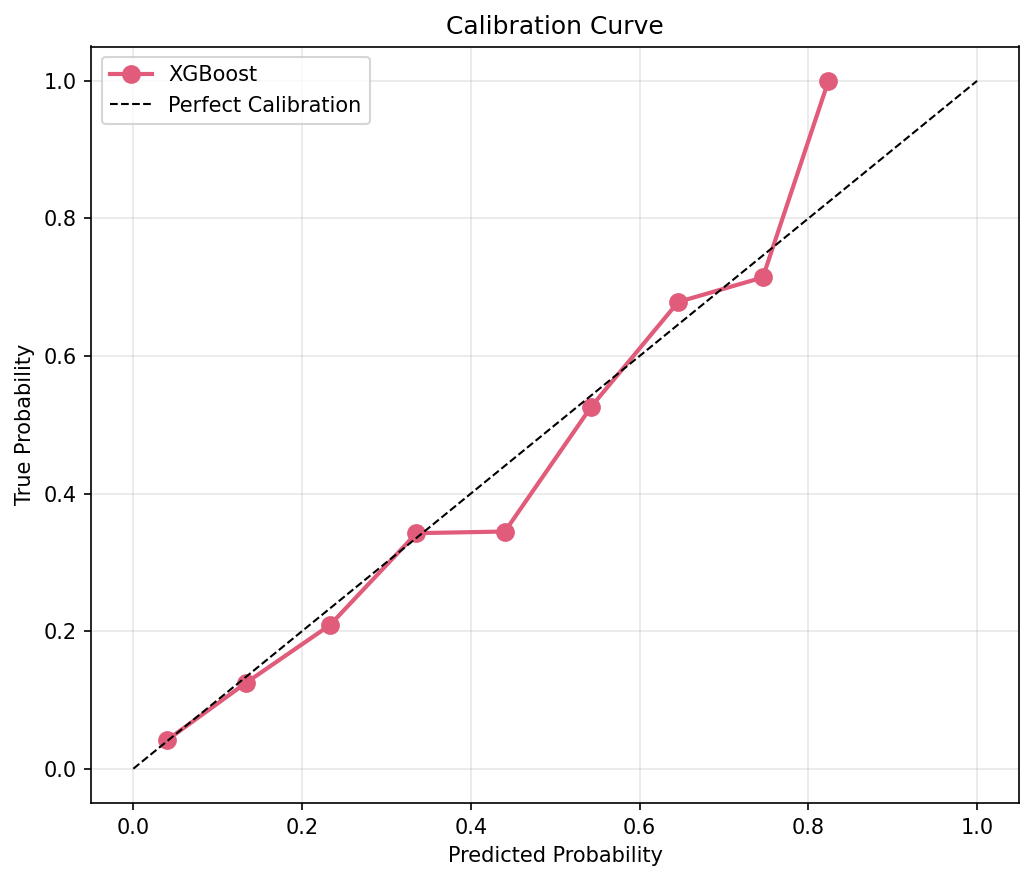
My model uses XGBoost, trained on 2021–2025 data. The factors employed here are intentionally simple. It leverages game events data from the NHL API, but lacks the substance that other models provide by including shift data, which requires more rigorous data cleaning, and/or EDGE data which I haven't played around with yet.
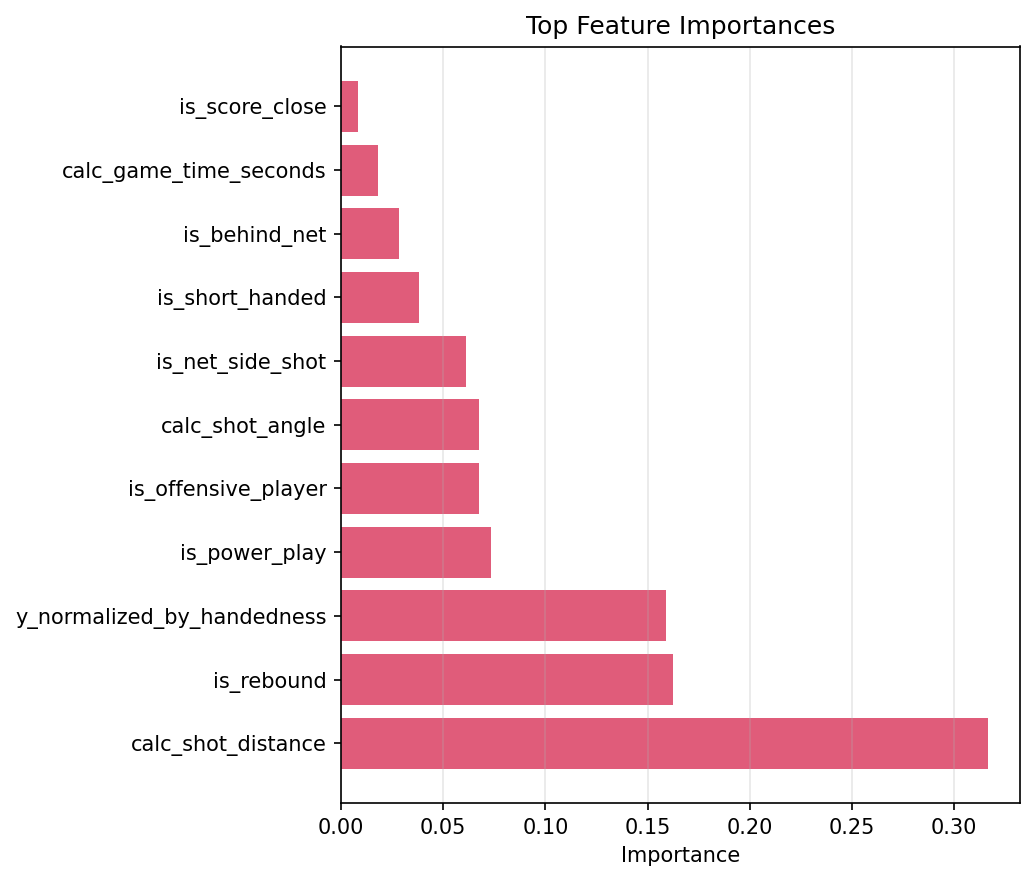
- Shot Distance
- Is it a Rebound?
- Lateral Position of the Shooter (handedness-adjusted)
- Is the Shooter on a Power Play?
- Is the Player a Forward?
- Shot Angle
- Is it a Net-Side Shot?
- Is the Shooter Short-Handed?
- Is the Shooter Behind the Net?
- Game Time
- Is the Score Close?
Game Projections & Playoff Simulation
The game projections model also uses XGBoost to produce game win probabilities. The main factors include:
- Rolling xG Differentials
- Head-to-Head Record
- Days of Rest
- Games Played
Each game is simulated 1,000 times via Poisson draws using season-average goal rates to produce win, OT, and shootout probabilities. The remaining regular season is then simulated 10,000 times via Monte Carlo to generate projected final standings, playoff probability, and division winner probability for every team.
The same model is leveraged to drive a 100,000 simulation Monte Carlo playoff bracket.