

About Me
Brent Peruski - I graduated from Purdue University in 2021 with a Bachelor of Science in Industrial Engineering and a minor in Electrical & Computer Engineering.
Connect & Support
- Twitter: @bpdatabases
- Email: [email protected]
- Support: Venmo
The earliest, specific influence I can remember that guided my interest in, and approach to, data analysis was Zach Lowe’s Grantland article, Kyle Korver: An Offense Unto Himself. That article combined simple data, tactics, and game tape to describe player impact in a way that each piece individually could not. The longest-running influence, and intro to Bayesian analysis, came from following Nate Silver’s political models on the now-defunct FiveThirtyEight. That site continually highlighted the effectiveness models can have when aggregating many data sources, even when some of those sources were unclean, to surface true signal amongst the noise.
I carried those interests through my time at Purdue, which exposed me to the technical skills required to perform deeper analysis, and into the workforce, where I focus on streamlining operations by making decisions with limited and unclean data.
bpdatabases
I originally built the ETL pipeline behind bpdatabases as a personal project to create a living data source for my own statistical models and analysis. I quickly learned that, in lieu of building dashboards or chugging away at ggplots, having a front end to visualize the results added far more utility to the work. It then evolved into a locally hosted site with a streamlined, simple UI that allowed me to track Red Wings games and players through these models. When the Wings weren’t playing, I found myself using the site to identify the most exciting matchups to watch that night. From there, I decided to round out the site with some core features and launch it publicly so I could access it away from home and share it with friends.
I was inspired to take on this journey after reading Rob Vollman’s Stat Shot: A Fan's Guide to Hockey Analytics and becoming a regular listener of the Evolving Hockey podcast. I won’t pretend to have the most advanced xG or game projection models on the market, but replicating those frameworks in-house allowed me to build a deeper understanding of the underlying data. My two main goals with the site are to (1) educate users on the benefits of Bayesian thinking and (2) visualize the gap between probabilistic, expected outcomes and actual on-ice results. It’s when looking into that gap that I hope to find novel areas of research and development to expand what this site offers.
From a technical perspective, all data on this site is sourced from the NHL’s API and processed through a nightly 3 AM ET ETL pipeline. For the longest time, that pipeline was powered by my laptop (which I had to leave running every night), but it has since been migrated to a dedicated desktop PC. I use Python to orchestrate the pipeline and fetch the data, but perform almost all of the transformation in R. The data is then split, with lower-level data stored locally and the data required for the web application pushed to a SQL database. The site itself is very simple, mostly HTML, PHP and a little JS.
This site is an independent project and is not affiliated with or endorsed by the National Hockey League (NHL). Its purpose is educational and analytical, offering original models, derived metrics, and detailed explanations to help users better understand hockey analytics and the role of randomness in game outcomes.
Expected Goals (xG) Model
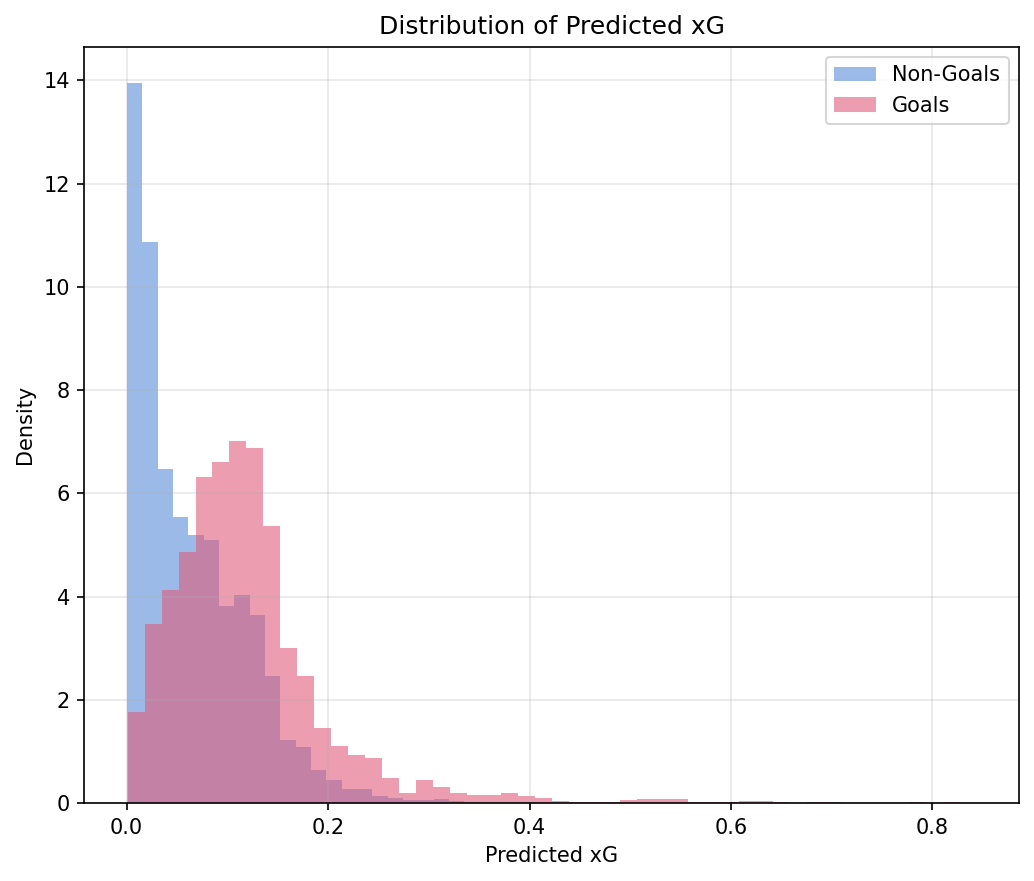
The majority of the analytics on this site are derived from my Expected Goals (xG) model. By focusing on shot quality over box score stats, xG provides a more stable metric by drawing richer information from every shot attempt rather than only those that become goals. For example, if you were assessing the performance of a team on a given night, xG takes into account the quality of the ~30 shots instead of just the ~3 goals. By expanding this to include the opponent's quality, we can calculate an xG For Percentage (xGF%), a metric that identifies which team earned the greater share of the expected goals. You can learn more about xG models from Evolving-Hockey, HockeyStats, and MoneyPuck, who have the best models that are publicly available. Hockey-Statistics also has a great write-up on building models.
I view xG primarily as a descriptive metric rather than a predictive one. It's a tool to identify the true merit of a performance by evaluating the quality of events that have already occurred. By focusing on the process, rather than the realized outcome, we can see through the randomness to better contextualize results. Instead of just answering "What happened?", xG allows us to answer "What did we expect to happen?" The space between those two answers is where the most interesting insights lie, prompting new theories, research, models and more.
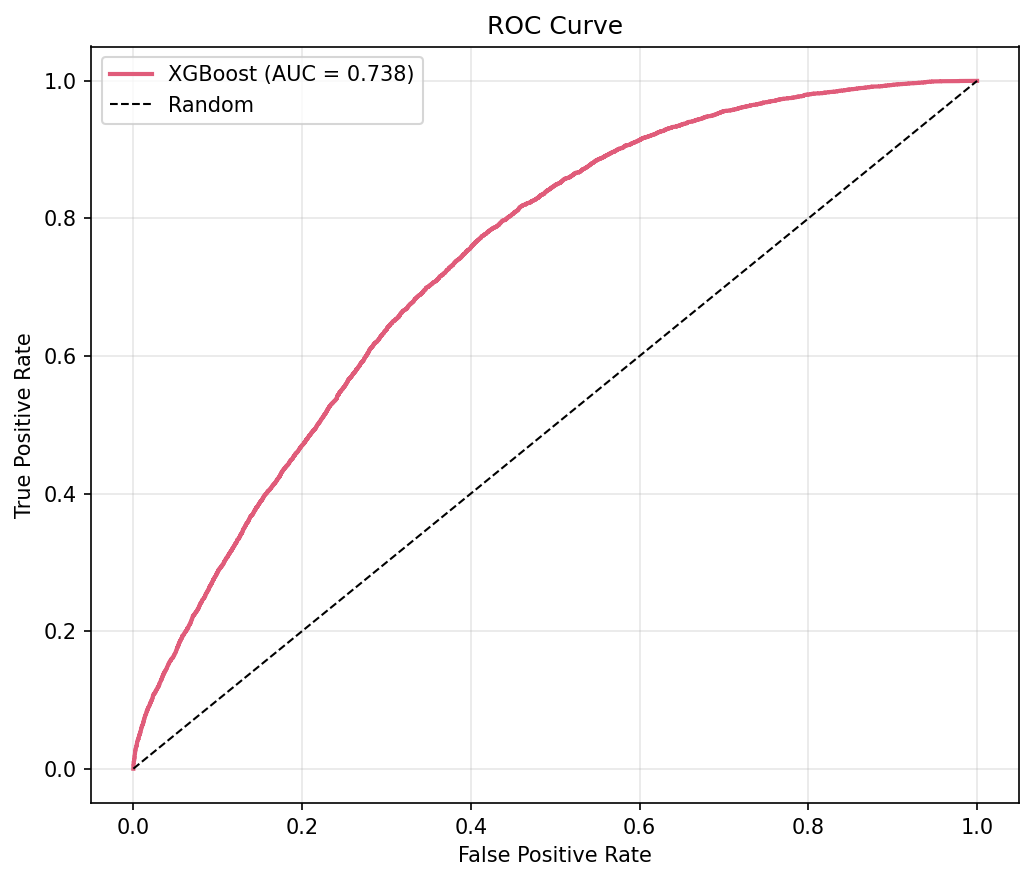
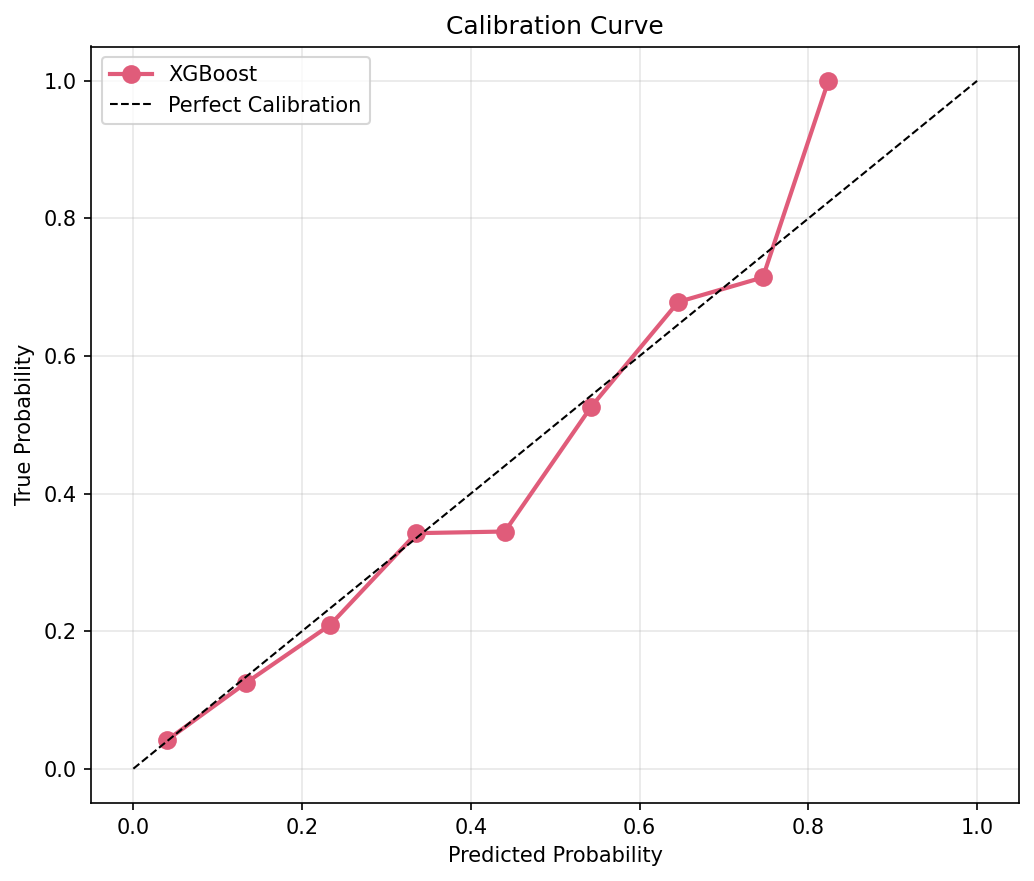
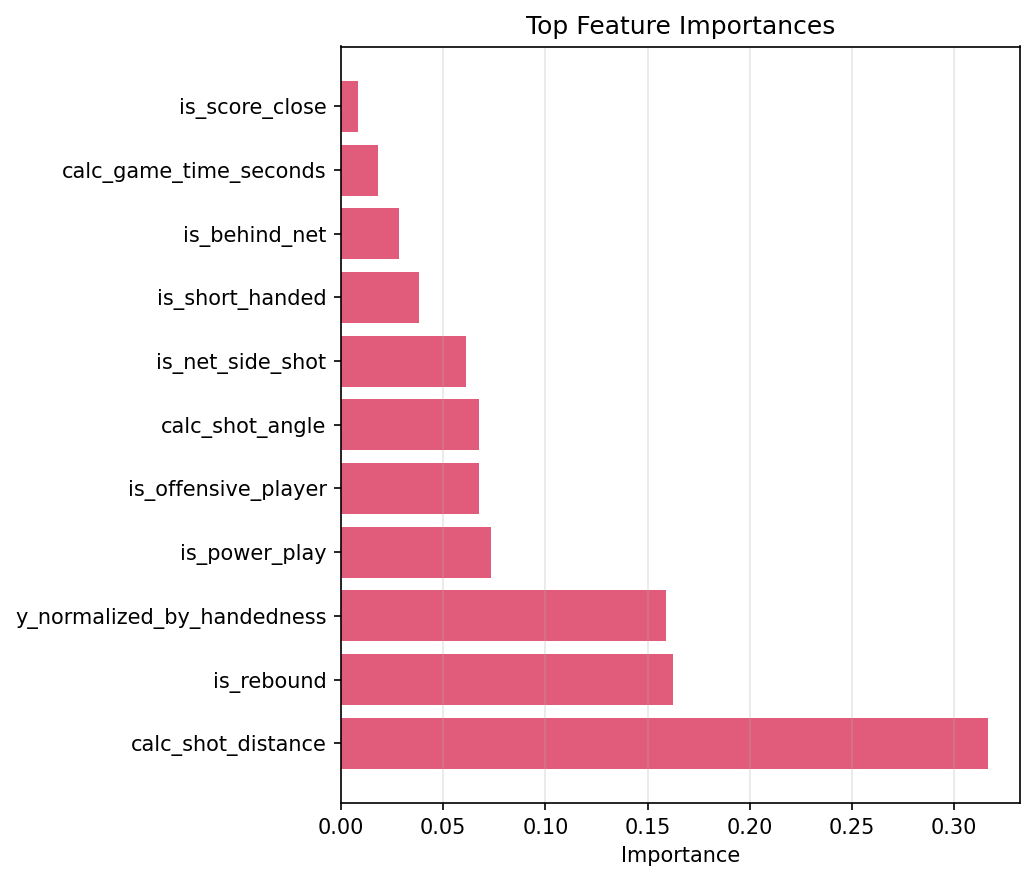
My model uses XGBoost, trained on the three most recent completed seasons (currently 2023–24 through 2025–26, regular season and playoffs). It's retrained each summer to keep with changes in trends, but more importantly change in how the NHL records game event data. The factors employed here are intentionally simple, made up of game events data from the NHL API. In the future, I'd like to expand this to include more advanced features from NHL EDGE, or other tracking data, but I haven't played around with it enough to incorporate those sources yet. xG is a well-explored space, so the effort I can put towards this project outside of day-job hours is better spent on other models and visuals in the short term. In brief, this model is simple, but I still have confidence in the results.
- Shot Distance
- Lateral Position of the Shooter (handedness-adjusted)
- Shot Angle
- Is the Player a Forward?
- Shot Type (wrist, snap, slap, tip-in, backhand, deflection, wrap-around, other)
- Is the Shooter on a Power Play?
- Game Time
- Is it a Rebound?
- Is it a Net-Side Shot?
- Is the Shooter Behind the Net?
- Previous Event (faceoff, shot on goal, missed shot, blocked shot, hit, giveaway/takeaway)
- Is the Shooter Short-Handed?
- Is the Score Close?
Game Projections & Playoff Simulation
Note: I am currently building a Bayesian hierarchical model to replace the simple model that exists today. As such, I’ll hold the dedicated write-up until that new model is released. I’m tentatively aiming for end of November 2026.
The shift to a Bayesian model will allow me to generate a range of plausible scoring rates for each team from xG data, recent form, rest and more. By doing this, instead of producing fixed estimates, I can feed those posterior draws directly into thousands of game simulations. By carrying that uncertainty through the entire process, the final win probabilities can reflect actual model confidence, rather than just the standard Poisson variance.
The game projections model, like the xG model, also uses XGBoost to produce game win probabilities. The main factors include:
- Rolling xG Differentials
- Head-to-Head Record
- Days of Rest
- Games Played
Each game is simulated 1,000 times via Poisson draws using season-average goal rates to produce win, OT, and shootout probabilities. The remaining regular season is then simulated 10,000 times via Monte Carlo to generate projected final standings, playoff probability, and division winner probability for every team.
The same model is leveraged to drive a 100,000 simulation Monte Carlo playoff bracket.
Release Notes
The list of updates below is not fully comprehensive, but is intended to highlight the most impactful changes made to this site and the models.
- [Oct 28, 2026] Released xG model v1.1 - A retrained version of v1.0 on the cleaned/updated pipeline data. It also incorporates two new types of factors: the shot type (wrist, slap, tip-in, etc.) and the event just before the shot (faceoff, hit, turnover, etc.). The gain is modest, it ranked goals for the 2025-2026 slightly better than v1.0 (AUC 0.75 vs 0.73). This was updated out of necessity rather than chasing large gains.
- [Oct 28, 2026] Refactored the ETL pipeline - The ETL pipeline has been completely overhauled, with a focus on data quality and future scaling. Several data issues were resolved, and all data has been backfilled through this new pipeline. A system to catch, and apply, late NHL stat corrections has also been implemented. This was a massive effort, but will allow me to dive back into the fun part - expanded analysis and building new models.
- [Aug 11, 2026] Added Cap Analyst's Bet to Lookups - This is a game intended to teach Bayesian thinking. This is done through a scenario where you are asked to assign a probability to a player's liklihood of scoring 20+ goals in a season as data is incrementally reviewed. You can then compare your priors and posteriors with a simple Bayesian model.
- [Jun 16, 2026] Added Chip Share Ledger to Lookups - This is a visualization tool with a zero-sum accounting of a team's season. By treating each game as two even-money wagers, where one wager is settled by actual results and the other settled by xG, we can visualize the gap between expected game results and actual game results.
Privacy Policy
Last updated: October 28, 2026
bpdatabases.com is a non-commercial hockey analytics site run by Brent Peruski. This section explains what information is collected when you visit and why. There are no analytics, no ads, and no tracking, and nothing is sold or shared for marketing.
Information collected automatically
- Server and network logs. Requests to this site pass through Cloudflare (security and content delivery) and Namecheap (my hosting provider). Both automatically record standard request details such as your IP address, browser type, the page requested, and the time. These logs are used for security, troubleshooting, and keeping the site running, and are kept according to those providers' standard practices.
- Rate limiting. The "Game Lookups" pages limit how often lookups can be run, to protect the database. To enforce this, the site stores a hash of your IP address together with the times of your recent lookups. It isn't used for anything else.
Cookies
- PHPSESSID is set only on the Calendar page (to remember the team you selected) and on Cap Analyst's Bet (to keep track of your game in progress). It holds a random identifier, not personal information. The session data stays on the server and is discarded automatically, and the cookie expires when you close your browser.
There are no advertising or analytics cookies.
Third-party services
Some files on these pages are loaded from other services. When your browser requests them, those services receive your IP address and browser information as part of delivering the file:
- Google Fonts (fonts.googleapis.com, fonts.gstatic.com) for the site's typeface.
- DataTables CDN (cdn.datatables.net) for table styling.
- NHL (assets.nhle.com) for player headshots.
- Cloudflare for all traffic to the site.
If you follow a link to another site, that site's privacy policy applies.
Pages behind authentication
The site also has a private, invite-only section used by a small group of friends for a fantasy league. Members sign in with a username and password and receive a sign-in cookie. For security, sign-in attempts are logged with the time, username, IP address, and browser. None of this applies to public visitors.
Your choices
You can block or clear cookies in your browser settings. The site still works without them, except that the Calendar won't remember your team and Cap Analyst's Bet needs the cookie to play.
Children
This site isn't directed at children under 13 and doesn't knowingly collect personal information from them.
Data and trademarks
Game data comes from the NHL's public API. bpdatabases is not affiliated with or endorsed by the NHL or its teams. NHL and team names and logos are trademarks of their respective owners.
Changes
If this policy changes, the "Last updated" date at the top of this section will change with it.
Contact
Questions about this policy or the site: [email protected]